- Afhalen na 1 uur in een winkel met voorraad
- Gratis thuislevering in België vanaf € 30
- Ruim aanbod met 7 miljoen producten
- Afhalen na 1 uur in een winkel met voorraad
- Gratis thuislevering in België vanaf € 30
- Ruim aanbod met 7 miljoen producten
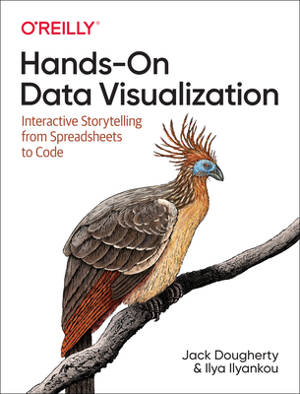
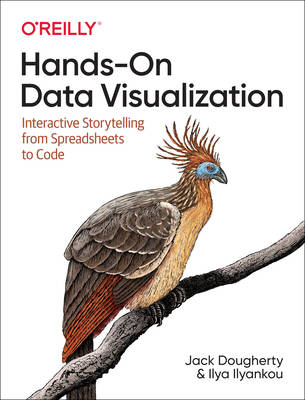
Hands-On Data Visualization
Interactive Storytelling from Spreadsheets to Code
Jack Dougherty, Ilya IlyankouOmschrijving
Tell your story and show it with data, using free and easy-to-learn tools on the web. This introductory book teaches you how to design interactive charts and customized maps for your website, beginning with simple drag-and-drop tools such as Google Sheets, Datawrapper, and Tableau Public. You'll also gradually learn how to edit open source code templates like Chart.js, Highcharts, and Leaflet on GitHub.
Hands-On Data Visualization takes you step-by-step through tutorials, real-world examples, and online resources. This practical guide is ideal for students, nonprofit organizations, small business owners, local governments, journalists, academics, and anyone who wants to take data out of spreadsheets and turn it into lively interactive stories. No coding experience is required.
- Build interactive charts and maps and embed them in your website
- Understand the principles for designing effective charts and maps
- Learn key data visualization concepts to help you choose the right tools
- Convert and transform tabular and spatial data to tell your data story
- Edit and host Chart.js, Highcharts, and Leaflet map code templates on GitHub
- Learn how to detect bias in charts and maps produced by others
Specificaties
Betrokkenen
- Auteur(s):
- Uitgeverij:
Inhoud
- Aantal bladzijden:
- 471
- Taal:
- Engels
Eigenschappen
- Productcode (EAN):
- 9781492086000
- Verschijningsdatum:
- 18/05/2021
- Uitvoering:
- Paperback
- Bestandsformaat:
- Trade paperback (VS)
- Afmetingen:
- 175 mm x 231 mm
- Gewicht:
- 739 g

Alleen bij Standaard Boekhandel
Beoordelingen
We publiceren alleen reviews die voldoen aan de voorwaarden voor reviews. Bekijk onze voorwaarden voor reviews.


